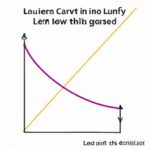
The Gini coefficient is a measure of income distribution within a population. It quantifies the degree of inequality, with 0 representing perfect equality and 1 denoting maximum inequality. The coefficient calculates the area between the Lorenz curve, a hypothetical line of perfect equality, and the actual income distribution curve. Countries with a higher Gini coefficient have a more uneven income distribution, manifesting as a wider income gap between the wealthy and the poor. Understanding the Gini coefficient aids policymakers in assessing and addressing income inequality through targeted interventions, ultimately fostering a more equitable society for all individuals to thrive and succeed.
Table of Contents
- Calculation method
- Criticisms and limitations
- Historical background
- Interpretation of values
- Real-world applications
(Understanding the Gini Coefficient)
The Gini coefficient measures income inequality within a population. It ranges from 0 (perfect equality) to 1 (maximum inequality). Countries with higher Gini coefficients have more unequal income distributions. This metric is widely used by economists and policymakers to analyze and compare income disparities among different nations. The Gini coefficient helps to identify social issues and develop targeted interventions to address them. It can also reflect broader societal trends and economic stability. Understanding the Gini coefficient is crucial for promoting fair and inclusive economic growth. By calculating this index, governments can tailor policies to reduce poverty and enhance social welfare. In essence, the Gini coefficient offers valuable insights into the distribution of wealth and resources within a society. It serves as a vital tool for promoting social justice and fostering a more equitable world for all.
Calculation method
When it comes to understanding the Gini coefficient, one crucial aspect is its calculation method. This method is like peering through a mathematical window into societal inequality, revealing disparities that often go unnoticed in everyday life.
To calculate the Gini coefficient, you first need data on income distribution within a specific population. Picture rows of numbers representing what each person makes – from the lowest earners struggling to get by to the wealthiest individuals basking in luxury.
Next, imagine organizing these incomes from smallest to largest; this process creates a visual ladder where each rung represents someone’s financial standing in society. With this structured list in hand, calculations can commence.
The actual computation involves plotting what’s known as the Lorenz curve—a graphical representation of income inequality—based on the data points gathered earlier. As you crunch numbers and plot curves, patterns start emerging like shadows fading under dawn’s light.
Through intricate mathematical maneuvers involving areas under curves and diagonal lines bisecting shapes on graphs emerges that single number: The Gini coefficient. It stands as a numerical sentinel guarding against ignorance of societal disparities—the higher it climbs above zero towards one, the starker those inequalities become apparent.
Picture watching this number fluctuate with changes in economic policies or shifts in social dynamics—it’s akin to peeking behind curtains at an ever-evolving play depicting human interactions with money and power. Emotions intertwine as you realize how profoundly such calculations reflect real lives unfolding around us every day.
This numeric entity serves not merely as a statistical artifact but rather as a mirror reflecting back our society’s essence—a reflection we may find inspiring or disheartening depending on where we stand along that income ladder. Its fluctuations echo whispers of hope or cries for change reverberating through communities near and far.
So next time you delve into discussions about wealth gaps or economic fairness, remember the journey taken by researchers crunching numbers to unveil hidden truths encoded within that deceptively simple figure: The Gini coefficient—an emblematic symbol bridging worlds of math and humanity together in profound ways.
Criticisms and limitations
When we delve into the realm of Gini coefficient, a metric that reflects income inequality within a society, it’s crucial to acknowledge the criticisms and limitations that surround its application. While this measure offers valuable insights into economic disparity, it is not without its challenges.
One significant critique of the Gini coefficient lies in its reliance on aggregate data, which can sometimes overlook nuances at lower levels of analysis. By condensing complex income distributions into a single number, this metric may oversimplify reality and mask disparities among specific demographic groups or regions. This limitation underscores the importance of complementing Gini coefficients with other measures to gain a comprehensive understanding of inequality dynamics.
Moreover, detractors argue that the Gini coefficient fails to account for non-monetary forms of wealth and well-being. Factors such as access to healthcare, quality education, and social mobility are vital components of overall equality but are often beyond the scope of traditional economic metrics like the Gini index. As such, critics emphasize the need for a more holistic approach to measuring societal welfare beyond purely financial considerations.
Another point of contention revolves around how outliers can skew Gini coefficient results. Extremely wealthy individuals or impoverished outliers can disproportionately influence the calculated value, potentially distorting interpretations about overall inequality levels within a population. Addressing these outliers effectively poses methodological challenges and requires careful consideration when interpreting Gini coefficients in real-world contexts.
Despite these criticisms and limitations surrounding the Gini coefficient’s utility in capturing multidimensional inequalities accurately, it remains an essential tool for policymakers and researchers striving to address socio-economic disparities proactively. By acknowledging these critiques while leveraging complementary metrics and qualitative insights alongside Gini calculations, stakeholders can gain more nuanced perspectives on inequality trends and craft targeted interventions that promote inclusive growth across diverse communities.
In essence, embracing a critical stance towards existing measures like the Gini coefficient paves the way for continuous refinement and innovation in assessing societal fairness comprehensively—a journey where introspection meets progress in shaping more equitable futures for all members of our global community.
Historical background
Ah, the historical background of the Gini coefficient is like uncovering an old treasure chest filled with stories that shaped its existence. Picture this: back in 1912, an Italian statistician named Corrado Gini was pondering how to measure income inequality within a society. It’s almost as if he held a magnifying glass up to society and saw all these disparities bubbling beneath the surface.
Intrigued by this socioeconomic puzzle, Gini concocted a formula that would later become known as the Gini coefficient. This wasn’t just any mathematical equation; it was a tool for revealing the stark divides between the haves and have-nots in a way that data tables couldn’t quite capture.
Imagine the world around him at that time – bustling cities teeming with immigrants seeking better lives, industrial revolutions shaping economies, and societal structures shifting like sand dunes in the wind. Amidst all this flux, Gini stood firm on his quest to quantify inequality.
As decades rolled by, economists and policymakers worldwide picked up on Gini’s brainchild. They realized its power lay not just in numbers but in what those numbers represented – human struggles, aspirations, and injustices woven into societies’ fabric.
The Great Depression of the 1930s cast a harsh light on income disparities. The Gini coefficient emerged as a beacon amidst economic turmoil – illuminating where resources pooled disproportionately and sparking conversations about fairness and justice.
Fast forward to today; we see countries grappling with wealth gaps widening like canyons while debates rage on about redistributive policies versus laissez-faire approaches. In this sea of statistical analyses and policy prescriptions, one thing remains clear – behind every decimal point of the Gini coefficient lies a narrative of hope or despair for countless individuals striving for better lives.
So next time you see that enigmatic symbol “G,” remember it carries within itself generations of stories – tales of triumph over adversity or tragedies born out of systemic inequities etched deep into our collective memory.
(Gini Coefficient and Lorenz Curve)
Interpretation of values
Interpreting the values of the Gini coefficient delves deep into understanding income distribution within a society. It’s not just about numbers on a page; it reflects real people and their livelihoods. A Gini coefficient of 0 represents perfect equality, where everyone has the same income, while a value of 1 signifies complete inequality, with one person holding all wealth.
When you see a Gini coefficient between 0 to 0.3, that indicates relatively equal wealth distribution—a sign of prosperity shared among many individuals in society living comfortable lives without extreme gaps between rich and poor.
Moving up the scale to around 0.4 to 0.6 shows moderate-income inequality. This range suggests that there are noticeable differences in wealth among segments of the population—an indication that some may be struggling while others enjoy higher standards of living.
However, when we observe a Gini coefficient exceeding 0.7, this signals severe income inequality gripping society tightly. In such cases, resources are concentrated disproportionately in the hands of few individuals or groups, leaving many others grappling with poverty and limited opportunities for growth and advancement.
The interpretation doesn’t stop at merely assigning numerical values but extends beyond statistical analysis to paint a vivid picture of societal dynamics and human experiences intertwined with economic disparities.
Imagine standing at two ends of the spectrum—the bottom representing those barely making ends meet while juggling multiple jobs just to survive each day; at the top end lie affluent individuals effortlessly affording luxuries most can only dream about—a stark contrast illustrating how unequal distributions impact daily lives across social strata.
This disparity isn’t just about money—it seeps into healthcare access, educational opportunities, housing stability—fundamental pillars shaping quality of life for every individual within communities touched by these uneven distributions.
So next time you come across a Gini coefficient value alongside its interpretation, remember it’s more than data—it embodies struggles faced by real people striving for fairness in an imbalanced world yearning for equity and solidarity amongst its diverse inhabitants seeking hope for brighter tomorrows together.
Real-world applications
The Gini coefficient, a statistical measure of income distribution within a given population, is not just an abstract concept confined to academic discussions. It finds real-world applications that impact individuals and societies at large.
In the realm of economics, governments and policymakers often rely on the Gini coefficient to assess the level of income inequality in a country. By understanding how wealth is distributed among citizens, they can formulate policies aimed at promoting social equality and economic stability. Imagine a nation where the rich keep getting richer while the poor struggle to make ends meet – this disparity highlighted by the Gini coefficient serves as a wake-up call for necessary interventions.
On an individual level, the Gini coefficient can also be eye-opening. Picture yourself comparing two cities: City A with a high Gini coefficient indicating significant wealth gaps and City B with a lower score suggesting more equitable distribution. Understanding these figures could influence your decisions on where to live or invest based on factors like job opportunities and potential for upward mobility.
Moreover, businesses utilize the Gini coefficient to analyze market dynamics and consumer behavior. For instance, companies launching new products need insights into purchasing power across different income brackets. By tapping into data derived from the Gini index, they can tailor their marketing strategies effectively – creating targeted campaigns that resonate with diverse socio-economic groups.
Beyond economics, healthcare systems benefit from this metric too. Health professionals use it to identify areas where access to medical services may be skewed due to financial constraints faced by certain populations. This insight enables them to allocate resources efficiently – ensuring adequate care reaches those who need it most regardless of their economic standing.
In essence, behind its numerical value lies a crucial tool that shapes policy directions impacting millions worldwide daily; evoking emotions ranging from concern over glaring inequalities exposed to hope inspired by possibilities pointed out for positive change through informed actions influenced by concrete statistics such as the Gini Coefficient- weaving together individuals’ lives in an intricate tapestry bound by shared experiences transcending borders defined not just economically but socially morally which drives towards better futures built upon understanding today’s realities shaping tomorrow’s dreams-aligned hand in hand forging ahead despite odds showing light amidst darkness reflecting possibilities emerging amid challenges faced head-on brimming with faith hope perseverance striving towards brighter days ahead united under one sky painted hues vibrant infinite showcasing diversity strength unity resilience humanity we are all part of this journey unfolding each day before us revealing paths anew beckoning us forth empowered equipped armed knowledge wisdom seeking solutions building bridges connecting hearts minds alike fostering growth progress justice equity love peace harmony world yearns embrace us whole fulfilling destinies intertwined intertwined interconnected interwoven eternally onwards forevermore everlasting timeless beings boundless spirit soaring heights uncharted realms awaiting exploration discovery Wonder awaits ever-present moment now Let’s walk forward together united purpose knowing our steps matter making difference shaping future yet envisioned dreamed possible come true…