The Gini coefficient is a statistical measure used to assess income inequality within a given population. It represents the extent to which the distribution of income or wealth deviates from perfect equality. The coefficient ranges from 0 to 1, where 0 indicates perfect equality (every individual has the same income) and 1 indicates maximum inequality (one individual has all the income, while the rest have none). This measure is often used by economists, policymakers, and social scientists to analyze income disparities and evaluate the effectiveness of various economic policies aimed at reducing inequality. By understanding the Gini coefficient, we can gain insights into the socioeconomic conditions of a population and work towards a fairer society.
(Gini Coefficient and Lorenz Curve)
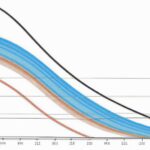
The Gini coefficient is a statistical measure used to assess income distribution within a population. It quantifies the inequality of income or wealth distribution, providing a numerical value between 0 and 1. A Gini coefficient of 0 represents perfect equality, where every individual or household has the same income or wealth. On the other hand, a coefficient of 1 indicates maximum inequality, where a single person or entity holds all the income or wealth. To calculate the Gini coefficient, researchers use Lorenz curves. The Lorenz curve plots the cumulative percentage of the population against the cumulative percentage of income or wealth received. The Gini coefficient is derived by measuring the area between the Lorenz curve and the line of perfect equality, which is often represented as a 45-degree line. A larger area between the two curves indicates greater income inequality and therefore a higher Gini coefficient. The Gini coefficient is widely used in economics, sociology, and other social sciences as an indicator of income inequality. It helps policymakers, researchers, and analysts understand the distribution of wealth or income and its impact on society. By studying the Gini coefficient over time or across different countries, analysts can evaluate the effectiveness of social and economic policies, identify trends, and highlight areas that require attention. It is important to acknowledge that there are limitations to the Gini coefficient. It only provides a snapshot of income or wealth distribution and does not consider factors such as social mobility, access to education, or quality of life. Additionally, the Gini coefficient is sensitive to changes in the middle-income brackets, making it challenging to compare coefficients across different income distributions. Therefore, it is essential to interpret the Gini coefficient in conjunction with other economic and social indicators to gain a comprehensive understanding of income inequality.Definition
The Gini coefficient is a statistical measure that quantifies the inequality in the distribution of income or wealth within a population. It is commonly used to assess and compare income inequality among different countries or regions, but it can also be applied within smaller subgroups, such as cities or demographic groups. The coefficient is named after Italian statistician Corrado Gini, who developed the concept in 1912. It is a numerical value between 0 and 1, where 0 represents perfect equality (i.e., everyone has the same income or wealth), and 1 represents maximum inequality (i.e., one person or group has all the income or wealth, while the others have none). The Gini coefficient is derived from the Lorenz curve, which is a graphical representation of the income or wealth distribution. The Lorenz curve plots the cumulative percentage of total income or wealth on the vertical axis against the cumulative percentage of the population on the horizontal axis. The Gini coefficient itself is calculated by dividing the area between the Lorenz curve and the line of perfect equality (a straight line that represents perfect income or wealth distribution) by the total area below the line of perfect equality. It is important to note that the Gini coefficient does not provide information about the overall size of the economy or the average income or wealth levels. Instead, it focuses solely on the distribution of income or wealth within a population. Therefore, two countries with similar Gini coefficients can still exhibit significant differences in terms of overall wealth or average income. The Gini coefficient is a widely used measure in economics and social sciences as it provides a concise and standardized representation of income or wealth inequality. It allows policymakers, researchers, and analysts to compare different countries or regions over time and assess the effectiveness of policies aimed at reducing inequality. Although the Gini coefficient provides valuable insights into inequality, it does have certain limitations. One limitation is that it only captures relative inequality and does not take into account absolute living standards. For instance, a country may have a relatively low Gini coefficient but still have a large proportion of the population living in poverty. Furthermore, the Gini coefficient may not capture all aspects of inequality, such as access to education, healthcare, or social mobility. These dimensions of inequality are essential to consider when examining overall societal well-being. In conclusion, the Gini coefficient is a statistical measure that quantifies income or wealth inequality in a population. It provides a standardized way to compare and analyze inequality both within and across countries. However, it is important to consider its limitations and complement its analysis with other indicators to obtain a comprehensive understanding of inequality.
Examples
Examples of Gini Coefficient Example 1: Income Distribution in Country A Let’s consider a hypothetical country called Country A. In Country A, the Gini coefficient is used to measure income inequality. The Gini coefficient ranges from 0 to 1, with 0 indicating perfect equality (where every individual has the same income) and 1 indicating extreme inequality (where one individual has all the income). Suppose in Country A, the Gini coefficient is measured at 0.4. This suggests that income inequality is moderate in the country. To understand this further, let’s examine the income distribution. In this case, 40% of the country’s total income is owned by the bottom 60% of the population, while the top 40% of the population holds the remaining 60% of the income. Example 2: Wealth Distribution in Country B Now let’s look at another example, this time focusing on wealth distribution. In Country B, the Gini coefficient is measured at 0.8, indicating high levels of wealth inequality. This means that a small percentage of the population holds a large portion of the country’s total wealth. For instance, in Country B, the top 20% of the population may own 80% of the wealth, while the remaining 80% of the population shares the remaining 20%. This example illustrates the significant wealth disparity within the country. Example 3: Education Attainment in Country C In addition to income and wealth, Gini coefficients can also be used to measure inequality in other areas, such as education. Let’s consider Country C, where the Gini coefficient is used to assess education attainment levels among the population. If the Gini coefficient for education in Country C is calculated at 0.3, it suggests a relatively equal distribution of educational opportunities across the population. In this case, the gap between individuals with the highest and lowest levels of education is relatively smaller compared to other countries. Example 4: Gender Wage Gap in Country D Another application of the Gini coefficient is to measure gender wage inequality. In Country D, the Gini coefficient for the gender wage gap may be calculated at 0.2. This indicates a relatively low level of gender-based income disparity. With this Gini coefficient, it can be inferred that women earn approximately 80% of what men earn in Country D. While there is still some inequality, the relatively low Gini coefficient suggests that gender wages are more equitable compared to other countries. These examples illustrate the versatility of the Gini coefficient as a measure of inequality in various domains, such as income, wealth, education, and gender wage disparities. By understanding and analyzing these examples, policymakers and researchers can gain valuable insights into the distribution of resources and the degree of inequality within different populations.
Formula
The Gini coefficient is a measure of inequality that is commonly used to assess income distribution within a population. It provides a single value between 0 and 1, where 0 represents perfect equality and 1 represents maximum inequality. The formula for calculating the Gini coefficient involves a simple mathematical expression. To begin, you need to have access to data that represents the distribution of income or wealth within a population. This data is typically arranged in a cumulative frequency table, where the rows represent income brackets and the corresponding cells display the cumulative percentage of the population that falls within each bracket. Once you have the cumulative frequency table, the next step is to calculate the area between the Lorenz curve and the line of perfect equality. The Lorenz curve is a graphical representation of the cumulative income distribution, and the line of perfect equality is a straight line that represents a perfectly equal distribution of income. The formula for the Gini coefficient is as follows: G = (A / B) Where G is the Gini coefficient, A represents the area between the Lorenz curve and the line of perfect equality, and B is the total area under the line of perfect equality. To calculate the value of A, you can use the trapezoidal rule or Simpson’s rule, which are mathematical methods for approximating the area under a curve. These methods involve dividing the area into smaller trapezoids or curvilinear segments, and then summing up the areas of these segments. Once you have obtained the values of A and B, you can simply divide A by B to find the Gini coefficient. The resulting value will indicate the level of income inequality within the population, with higher values indicating greater inequality. It is worth noting that the Gini coefficient can also be calculated using other methods, such as the dissimilarity index or the generalized entropy index. However, the formula described above is one of the most commonly used and widely recognized approaches for calculating the Gini coefficient. In conclusion, the Gini coefficient is a measure of income inequality that is computed using a formula involving the area between the Lorenz curve and the line of perfect equality. By calculating the Gini coefficient, researchers and policymakers can gain insights into the distribution of income or wealth within a population, and use this information to inform policies and interventions aimed at reducing inequality.
Interpretation
The interpretation of the Gini coefficient plays a crucial role in understanding the level of income or wealth inequality within a society. It provides valuable insights into the distribution of resources, highlighting the gap between the rich and the poor. The Gini coefficient ranges between 0 and 1, where 0 represents perfect equality (every individual has the same income or wealth) and 1 signifies maximum inequality (one individual holds all the income or wealth, while others have none). When interpreting the Gini coefficient, a value close to 0 (typically ranging from 0 to 0.3) signifies a more equal distribution of income or wealth. It suggests that resources are fairly distributed among the population, with minimal gaps between different segments. This level of economic equality often implies increased social cohesion and harmony, promoting a sense of fairness among individuals. Alternatively, a Gini coefficient value closer to 1 (usually ranging from 0.7 to 1) indicates higher levels of income or wealth inequality. This means that a significant portion of resources is concentrated in the hands of a few individuals or groups, while the majority are left with limited access to resources. High levels of inequality can lead to social tensions, disparities in education, healthcare, and lower overall well-being within a society. It is also important to note that the interpretation of the Gini coefficient may vary depending on the context and the specific country being analyzed. For instance, a relatively high Gini coefficient in a developed country might suggest higher income disparities, while the same value in a developing country might indicate an improvement in wealth distribution as it moves towards equitable development. Furthermore, changes in the Gini coefficient over time can be used to assess the effectiveness of various policies aimed at addressing inequality. If the Gini coefficient is decreasing, it indicates that income or wealth disparities are reducing, implying that policies focused on wealth redistribution, social protection, or income support are proving successful. Conversely, an increasing Gini coefficient implies that inequality is worsening, indicating a need for policy interventions to address the issue. In conclusion, the interpretation of the Gini coefficient is fundamental in understanding the level of income or wealth inequality within a society. By analyzing this measure, policymakers, researchers, and economists can gain valuable insights into the distribution of resources and determine the effectiveness of policies aimed at reducing inequality and promoting a more equitable society.
Limitations
The Gini coefficient is a statistical measure that is commonly used to assess income inequality within a population. While it is a useful tool, like any statistical measure, it has certain limitations that must be taken into consideration. Understanding these limitations is crucial in interpreting and utilizing the Gini coefficient effectively. Here are some key limitations of the Gini coefficient: 1. Limited Focus: The Gini coefficient focuses solely on income distribution and does not consider other important dimensions of inequality such as wealth, education levels, or access to basic necessities. Therefore, it provides a limited perspective on overall inequality and may not accurately reflect the true extent of disparities within a society. 2. Lack of Context: The Gini coefficient does not provide any contextual information. It fails to account for factors such as the level of economic development, social and cultural norms, or government policies that may influence income distribution. Consequently, comparing Gini coefficients across different contexts can be misleading and may not accurately reflect the underlying causes and consequences of inequality. 3. Sensitivity to Population Size: The Gini coefficient is sensitive to changes in population size. Even small fluctuations in the number of individuals included in the analysis can significantly affect the calculated coefficient. This sensitivity can make it difficult to compare Gini coefficients between different time periods or regions with varying population sizes. 4. Lack of Sensitivity to Distributional Changes: The Gini coefficient is not very sensitive to changes in the middle-income brackets. It primarily focuses on the extremes of the income distribution, which means that significant changes in income disparities within the middle-income groups could go unnoticed. As a result, the Gini coefficient may fail to capture important shifts in income inequality that occur within the middle class. 5. Assumption of Income Homogeneity: The Gini coefficient assumes that all income units are equal within their respective income brackets. This assumption overlooks the fact that individuals within the same income bracket may have varying levels of inequality themselves. It also does not take into account non-monetary factors, such as access to public services or social benefits, which can affect individuals’ overall well-being. In conclusion, while the Gini coefficient is a widely used and valuable measure of income inequality, it has its limitations. Understanding these limitations is crucial in interpreting and applying the results obtained through the Gini coefficient, as it provides only a partial picture of inequality and should be used in conjunction with other measures to gain a more comprehensive understanding of the dynamics of income distribution within a society.