Types of income inequality measures are essential tools used to analyze and understand the disparities in wealth distribution within a society. These measures include the Gini coefficient, which calculates inequality based on income distribution; the Theil Index, which measures inequality between different groups within a population; the Palma ratio, which compares the income share of the top 10% with the bottom 40%; and the Atkinson index, which focuses on inequality at higher income levels. By utilizing these measures, policymakers and researchers can gain insights into the extent of income inequality and devise strategies to promote more equitable societies.
(Income and Wealth Inequality: Crash Course Economics #17)
There are several types of income inequality measures commonly used to assess disparities in income distribution within a population. These measures provide quantitative data that help economists, researchers, and policymakers understand the extent and nature of income inequality. Here are some of the key types of income inequality measures: 1. Gini coefficient: The Gini coefficient is one of the most widely used measures of income inequality. It quantifies income inequality on a scale from 0 to 1, where 0 represents perfect equality and 1 represents complete inequality. A higher Gini coefficient indicates greater income inequality. 2. Theil index: The Theil index measures income inequality by evaluating the proportion of total income that is owned by different groups within a population. It considers both within-group and between-group inequality and can be decomposed into various components to determine the contribution of different factors to overall income inequality. 3. Palma ratio: The Palma ratio focuses on inequality between the highest and lowest income earners. It compares the income share of the top 10% to the income share of the bottom 40% of the population. This measure is particularly useful for assessing relative inequalities within population segments. 4. Atkinson index: The Atkinson index measures income inequality while considering society’s aversion to inequality. It incorporates a parameter that reflects the society’s equity preferences, enabling researchers to assess inequality with respect to social welfare. 5. Bottom 10% share: This measure examines the income share of the bottom 10% of the population. It provides insights into the well-being of the most economically disadvantaged individuals. These measures, together with other indicators like percentile ratios, income quintiles, and relative poverty rates, offer various perspectives on income inequality. Researchers employ multiple measures to gain a comprehensive understanding of income distribution patterns, allowing policymakers to design targeted interventions to mitigate inequality effectively.Definition of income inequality
Definition of income inequality refers to the unequal distribution of income among individuals or households within a specific area or society. It indicates the extent to which income is unevenly distributed across different economic groups, such as the rich, middle class, and poor. Income inequality is typically measured using various statistical indicators, such as the Gini coefficient, the Theil index, or the Palma ratio. These measures provide insights into the dispersion of income levels within a given population. By understanding the degree of income inequality within a society, policymakers and researchers can assess the fairness of income distribution and identify potential socioeconomic issues that may arise from such disparities. The Gini coefficient, one of the most widely used measures of income inequality, ranges from 0 to 1. A Gini coefficient of 0 represents perfect equality, indicating that each person has the same income, while a Gini coefficient of 1 represents extreme inequality, where one person holds all the income. The coefficient is calculated based on the Lorenz curve, which plots the cumulative share of income against the cumulative share of the population. Another commonly used measure, the Theil index, provides a different perspective on income inequality. It assesses the relative distribution of income within different subgroups, such as regions or ethnic groups, and compares them to the overall income distribution. The index takes into account both within-group inequality and between-group inequality. The Palma ratio, on the other hand, focuses on the ratio of the income shares held by the top 10% of the population compared to the bottom 40%. This measure is particularly useful in analyzing income disparities that exist between the rich and the poor, highlighting the concentration of income at the top end of the distribution. Income inequality can have significant social, economic, and political ramifications. High levels of income inequality may lead to social unrest, foster a sense of injustice, or hinder social mobility. Moreover, it can contribute to economic inefficiencies and hinder sustainable development by limiting access to opportunities, education, and healthcare. Understanding the definition of income inequality is essential for policymakers and researchers as they strive to design strategies to tackle and reduce disparities. By comprehensively measuring and analyzing income inequality, it becomes possible to identify the root causes and implement effective policies aimed at promoting a more equitable distribution of income. In conclusion, income inequality refers to the unequal distribution of income among different economic groups within a society. It can be measured using various indicators, including the Gini coefficient, the Theil index, and the Palma ratio. Understanding income inequality is crucial for policymakers and researchers to address societal issues and work towards a fairer distribution of income.
Gini coefficient
Gini coefficient is a widely used measure to assess income inequality within a specific population or country. It provides a numerical representation that quantifies the level of income disparity, specifically focusing on the distribution of income among individuals or households. The Gini coefficient ranges from 0 to 1, where 0 indicates perfect equality, meaning that everyone within the population has the same income, and 1 represents maximum inequality, where a single individual possesses all the income. The closer the Gini coefficient is to 1, the more unequal the income distribution is considered to be. The Gini coefficient is constructed through the Lorenz curve, a graphical representation of income distribution. The Lorenz curve plots the cumulative proportion of income received on the y-axis against the cumulative percentage of the population on the x-axis. The Gini coefficient is then calculated as the area between the Lorenz curve and the line of perfect equality, divided by the total area under the line of perfect equality. Gini coefficients have become a vital tool for policymakers and economists to evaluate income inequality and its impacts on various socio-economic factors. By examining the degree of income concentration within a society, governments can identify areas of concern that require intervention or policy changes. Moreover, Gini coefficients allow for cross-country comparisons and the assessment of income inequality trends over time. Researchers commonly apply Gini coefficients to measure inequality both within and across countries, enabling policymakers to gauge the effectiveness of their economic and social policies in reducing inequality. It is important to note that the Gini coefficient alone does not provide a complete picture of income inequality. Other factors such as wealth inequality, social mobility, and access to essential services and opportunities should also be considered. Additionally, Gini coefficients only reflect a specific point in time or a particular population, which means they may not capture dynamic changes or differences among various demographic groups within a society. Despite its limitations, the Gini coefficient remains a practical and widely used measure to grasp the level of income inequality and its implications. Its simplicity and ease of calculation have made it an invaluable tool in academic research, policy analysis, and public discourse surrounding income distribution and inequality.
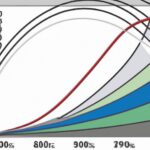
Lorenz curve
The Lorenz curve is a graphical representation that measures income inequality within a population. It was developed by the American economist Max O. Lorenz in 1905, and it has since become an essential tool in the field of economics for understanding and analyzing income distribution. The Lorenz curve is constructed by plotting the cumulative share of income on the y-axis and the corresponding cumulative share of the population on the x-axis. This means that the Lorenz curve captures the distribution of income across different percentiles of the population. The diagonal line on the Lorenz curve represents perfect equality, where each percentile of the population would have an equal share of income. Any deviation from this line indicates income inequality. The further away the Lorenz curve is from the diagonal line, the higher the degree of inequality. The area between the Lorenz curve and the diagonal line represents the extent of income inequality in the economy. A larger area indicates greater inequality, while a smaller area suggests a more equal distribution of income. For example, if the Lorenz curve lies below the diagonal line, it suggests that a small proportion of the population controls a significant share of the income. One common summary measure derived from the Lorenz curve is the Gini coefficient. This coefficient is a numerical representation of income inequality and is calculated by dividing the area between the Lorenz curve and the diagonal line by the total area below the diagonal line. The Gini coefficient ranges from 0 to 1, with 0 indicating perfect equality and 1 representing maximum inequality. The Lorenz curve and the Gini coefficient provide valuable insights into income disparities within a society. They allow economists and policymakers to understand the distribution of income, identify areas of income inequality, and design policies to address these disparities. By using the Lorenz curve, researchers can compare income distributions across different countries, regions, or time periods to assess changes in income inequality over time. In conclusion, the Lorenz curve is a visual representation of income inequality, with the diagonal line indicating perfect equality. It provides a graphical tool to understand the distribution of income within a population and helps to calculate summary measures such as the Gini coefficient. This information aids in analyzing the effects of economic policies, promoting fairness, and reducing income disparities in society.
Palma ratio
The Palma ratio is a widely-used measure of income inequality that focuses on the distribution between the top and bottom percentiles of a population. Named after Chilean economist Gabriel Palma, this ratio provides a succinct summary of income concentration and is especially useful in comparing income inequality between different countries. The Palma ratio is calculated by dividing the share of income held by the top 10% of earners by the share of income held by the bottom 40%. This measure is particularly insightful as it stands in contrast to other income inequality measures, such as the Gini coefficient, which focus on the entire distribution of income within a society. By examining the relative shares of income between the top 10% and the bottom 40%, the Palma ratio provides a clearer picture of the extent to which the wealthiest individuals in a society benefit when compared to the less affluent. It highlights the concentration of income among the top earners and the precariousness of the economic situation for those at the bottom. What makes the Palma ratio particularly useful is its ability to capture changes in income distribution over time. It is often employed to compare income inequality across countries, as it offers a more concise summary than other measures. This allows for easier identification of patterns and trends in income inequality, thus enabling policymakers and researchers to focus their efforts where the need for intervention is greatest. One strength of the Palma ratio lies in its simplicity. Its calculation only requires two data points – the shares of income held by the top 10% and the bottom 40% – making it straightforward to apply and interpret. Additionally, its focus on the extreme ends of the income distribution provides a clear lens through which to view income inequality, without being influenced by the middle-income groups. However, some critics argue that the Palma ratio may oversimplify the complexities of income inequality. By focusing solely on the top 10% and bottom 40%, it overlooks the experiences of individuals falling in between these two groups. Additionally, the Palma ratio may be less effective in capturing other dimensions of inequality, such as wealth disparities or variations within income groups. In conclusion, the Palma ratio is an important tool for measuring income inequality, particularly when comparing different countries or tracking changes over time. By highlighting the concentration of income between the top 10% and bottom 40%, it provides valuable insights into the distribution of wealth in a society. While it has its limitations, the Palma ratio remains an essential component of the toolkit for those seeking to understand and address income inequality.
Theil index
The Theil index, also known as the Theil inequality coefficient, is a statistical measure used to quantify income inequality within a given population or across different sub-groups. It was developed by economist Henri Theil in the 1960s and has since become a widely-used indicator in socioeconomic research. The Theil index provides a way to measure the disparity in the distribution of income, taking into account both the differences in the income levels and the population shares of different groups. It can be applied to various social and economic contexts, such as income inequality between individuals, regions, or countries. Mathematically, the Theil index is calculated using a formula that combines two components: the average income share and the relative income share. The index is represented by the Greek symbol θ and can be defined as: θ = (1/N) ∑ [(xi / X) * ln(xi / X)] Here, xi represents the income of each individual or sub-group, X is the total income of the population, and N is the number of individuals or sub-groups. The ln function denotes the natural logarithm. The Theil index ranges from 0 to positive infinity. A value of 0 indicates perfect equality, meaning that each individual or sub-group has the same income share. On the other hand, a higher value indicates greater income inequality, with higher values representing more pronounced disparities. One of the advantages of using the Theil index is its ability to capture both intra-group and inter-group inequality. It accounts for inequality within a particular sub-group, as well as the differences in income distribution between different sub-groups. This makes it a comprehensive measure that provides insights into various forms of inequality. Moreover, the Theil index is robust and can be used with different types of income distributions, including those that follow a normal distribution or have heavy tails. Its versatility allows researchers to analyze income inequality across different contexts and populations. The Theil index has been widely used in research and policy analysis to assess income inequality and its implications. It has contributed to understanding the extent of income disparities within and between countries, identifying vulnerable groups, and developing targeted policies to address inequality. In conclusion, the Theil index is a valuable tool for measuring income inequality. It captures both within-group and between-group disparities and provides a comprehensive indicator of income distribution. By enabling researchers and policymakers to quantitatively analyze inequality, the Theil index contributes to informed decision-making and the development of effective interventions to reduce income disparities.