The Gini Coefficient measures income inequality, aiding policymakers in designing effective social welfare programs. It evaluates fairness in income distribution, guiding efforts to reduce disparities among individuals. Applied in economics, sociology, and policy analysis, the Gini Coefficient highlights disparities and informs strategies for equitable wealth distribution. By capturing social and economic inequalities, it enhances societal understanding of wealth gaps and promotes inclusive development. Policymakers rely on the Gini Coefficient to monitor progress in combating poverty and fostering social justice. Its versatility in various disciplines underscores its significance in shaping inclusive policies and fostering economic prosperity for all.
Table of Contents
- Calculation of Gini Coefficient
- Definition of Gini Coefficient
- Interpretation of Gini Coefficient
- Limitations of Gini Coefficient
- Real-world applications of Gini Coefficient
(Gini Coefficient and Lorenz Curve)
The Gini coefficient is a statistical measure that helps quantify income inequality within a population. It ranges from 0 to 1, where 0 represents perfect equality, and 1 indicates extreme inequality. This index plays a crucial role in understanding the distribution of wealth and income within a society.
One of the main applications of the Gini coefficient is in economics, where it is used to analyze disparities in income and wealth distribution. Governments and policymakers utilize this measure to design targeted interventions that aim to reduce inequality and promote economic growth.
Furthermore, the Gini coefficient has found widespread use in sociology to study social mobility and access to opportunities across different socio-economic groups. By gaining insights into these disparities, researchers can propose strategies to bridge the gap and create a more equitable society.
In addition to its academic and research applications, the Gini coefficient is also utilized in business and finance to assess market concentration and competitive dynamics. Companies can leverage this measure to understand consumer behavior and market trends, enabling them to make informed decisions that drive business success.
Overall, the Gini coefficient serves as a valuable tool in various fields, offering a comprehensive look at income distribution and inequality that guides policy-making and strategic planning for a more inclusive and sustainable future.
Calculation of Gini Coefficient
The Gini coefficient, a measure of income inequality within a population, is crucial in understanding the distribution of wealth. Calculating this coefficient involves diving deep into economic data and mathematical formulas that reveal how fairly or unfairly resources are spread among individuals.
To compute the Gini coefficient, you first need to arrange individual income values from lowest to highest. Picture rows of numbers dancing on your screen like performers taking positions on a grand stage. Each number represents someone’s earnings – their hard work, struggles, and triumphs all condensed into these digits.
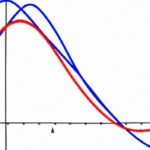
Next comes the cumulative percentage plot – imagine drawing lines connecting these points together. The curve takes shape, showcasing visually how incomes stack up against each other across society. It’s like unveiling a hidden map that reveals who holds the lion’s share and who barely scrapes by.
Now it’s time for some math magic! Through intricate calculations involving areas under curves and diagonal lines bisecting them with precision akin to an artist crafting brush strokes on canvas, the Gini coefficient emerges as a numerical expression of inequality – 0 representing perfect equality where everyone earns equally and 1 depicting extreme inequality with one person hoarding all riches.
Behind every formula lies stories untold – tales of lives shaped by economic disparities etched in statistical patterns. There’s palpable tension in those equations as they unravel societal imbalances that fuel debates around fairness and justice.
As you crunch numbers and analyze trends, emotions may stir within you – empathy for those marginalized by unequal opportunities juxtaposed with admiration for resilience amidst adversity. The figures pulsate with energy reflecting human experiences compressed into graphs plotted on axes symbolizing struggle versus privilege.
In grasping the significance of calculating the Gini coefficient, you delve beyond mere statistics; you uncover narratives woven through data threads that bind us all in this intricate web of existence where equity remains both idealized goal and distant dream.
Definition of Gini Coefficient
The Gini coefficient, a term that might sound fancy at first, but its concept is quite simple and vital in understanding income distribution within a population. Imagine you’re at a party with ten friends, and there’s a plate of cookies to share. If one person eats seven cookies while the other nine only have one each, you’d intuitively sense the unfairness in how those treats were distributed.
Well, the Gini coefficient (named after Italian statistician Corrado Gini) quantifies this inequality numerically so we can gauge how equally or unequally wealth or income is dispersed among individuals in a specific group. It ranges between 0 and 1 – where 0 signifies perfect equality (everyone has an identical slice of the pie), while 1 indicates extreme inequality (all but one hold nearly all resources).
Understanding this statistical measure becomes crucial when assessing societal disparities or economic policies’ effectiveness. When governments analyze their countries’ Gini coefficients over time, they gain insights into whether their efforts are narrowing or widening income gaps among citizens.
Picture two neighboring nations: Country A boasts a low Gini value due to fairer wealth sharing through progressive taxation systems and ample social welfare programs; meanwhile, Country B’s higher coefficient hints at more concentrated riches among an elite few amid poor living standards for many others.
Emotionally resonating scenarios like these illustrate why economists worldwide rely on the Gini coefficient as it goes beyond mere numbers – it embodies real people struggling under unequal opportunities and access to resources. In essence, it’s not just about statistics; it tells stories of privilege versus deprivation etched onto societies’ fabric.
Whether you’re delving into macroeconomic trends or discussing poverty alleviation strategies with policymakers, grasping the significance of the Gini coefficient enriches your analyses by shedding light on systemic injustices or positive redistributive outcomes shaping our collective well-being. So next time someone mentions this intriguing metric during debates about financial fairness or social equity – remember: behind every number lies human experiences waiting to be understood and improved upon for a fairer tomorrow!
Interpretation of Gini Coefficient
Understanding the Gini coefficient is like peering through a window into society’s economic soul. This numerical value, often used in economics to measure income distribution within a population, reveals much about disparities and inequalities.
Imagine this: you have a city where wealth flows unevenly among its residents. The Gini coefficient becomes the storyteller of this financial landscape. If it nears 0, it signals an equal distribution—everyone holding hands financially. But if it edges towards 1, inequality rises like storm clouds on the horizon.
So why does this matter? Well, think of your neighbor who works day and night yet struggles to make ends meet while another drives luxury cars without batting an eye. The Gini steps in as the referee of fairness or injustice in such scenarios.
Now picture a graph plotting various points representing different income levels across society. As we trace these dots along the axis, patterns emerge—the rich soar high while others languish below. Through such visual aids and statistical calculations lies the key to deciphering societal divides encapsulated by that magical number known as the Gini coefficient.
But beware—it’s not just about slicing numbers; emotions run deep here too! Empathy for those at society’s fringes may tug at our hearts when confronted with stark realities painted by this metric. It ignites passions for change—to bridge gaps and create avenues for equality where all can thrive together harmoniously.
The beauty of understanding the interpretation of Gini lies not only in unraveling data but also in decoding human narratives hidden within statistics. Each decimal point speaks volumes—a whisper urging us to strive for inclusivity or warning against widening gulfs that threaten social cohesion.
In essence, interpreting the Gini coefficient transcends mere mathematics; it plunges us into reflections on justice, compassion, and solidarity among members of our shared community.
(Understanding the Gini Coefficient)
Limitations of Gini Coefficient
The Gini Coefficient is a powerful tool used to measure income inequality within a population, but like all things in life, it’s not without its limitations. Let’s dive into some of the drawbacks that come with relying solely on this metric.
One major limitation of the Gini Coefficient is that it only provides a snapshot of inequality at a specific point in time. It doesn’t tell us anything about how that inequality has evolved over time or what factors may have contributed to changes in income distribution. This can be frustrating for policymakers and researchers looking to understand the root causes of poverty and wealth disparities.
Another issue is that the Gini Coefficient fails to capture certain nuances within society. For example, it doesn’t account for non-monetary forms of wealth like access to education, healthcare, or social capital. These are crucial components of well-being that can significantly impact an individual’s quality of life but aren’t reflected in traditional measures of income inequality.
Moreover, the Gini Coefficient assumes perfect information and rational decision-making by individuals when evaluating income distributions. In reality, people may not always make optimal choices due to various constraints such as limited knowledge, biases, or institutional barriers. This means that the actual level of inequality experienced by different groups could be higher or lower than what the coefficient suggests.
Furthermore, there are challenges related to data collection and accuracy when calculating the Gini Coefficient. Discrepancies in reporting methods across countries or regions can lead to inconsistent results, making it difficult to compare levels of inequality globally. Additionally, outliers or extreme values in income distribution can skew results and paint an inaccurate picture of overall economic disparity.
In conclusion, while the Gini Coefficient offers valuable insights into income inequality patterns within populations, its limitations remind us that no single metric can fully encapsulate the complexities of social stratification and disparities. To gain a comprehensive understanding of equity issues, we must complement quantitative measures like the Gini Index with qualitative research and contextual analysis rooted in empathy and human experiences.
Real-world applications of Gini Coefficient
The Gini Coefficient isn’t just a number on a page; it’s a powerful tool that shapes real-world decisions and policies. In understanding its significance, we uncover the intricate ways it influences our daily lives.
One significant application of the Gini Coefficient lies in economics. It acts as a compass, guiding policymakers in shaping income distribution strategies. By analyzing this coefficient, governments can pinpoint areas where wealth is disproportionately concentrated and implement measures to foster more equitable growth.
In urban planning, the Gini Coefficient plays an essential role too. Imagine strolling through two neighborhoods: one flourishing with prosperity – gleaming skyscrapers and bustling businesses lining every street; contrasted by another struggling with dilapidated buildings and empty storefronts. This disparity vividly reflects in their Gini Coefficients. Urban planners utilize these metrics to design interventions that bridge the gap between affluent and impoverished regions, fostering inclusive development.
Furthermore, within healthcare systems worldwide, the application of the Gini Coefficient holds immense significance. Picture two communities facing contrasting health outcomes due to unequal access to medical services – one thriving with well-equipped hospitals catering to all needs while another grappling with insufficient resources leading to compromised care quality for many residents. By examining disparities using the Gini Index, healthcare providers identify key areas requiring attention and channel resources effectively to ensure fair access for all individuals regardless of socio-economic status.
Education also benefits from insights gleaned from the Gini Coefficient analysis. Visualize schools teeming with eager students engaged in dynamic learning experiences versus institutions plagued by underfunding resulting in limited educational opportunities for children from marginalized backgrounds. The education sector harnesses this metric to address inequities head-on—ensuring every child receives quality education irrespective of economic circumstances.
Every day, behind closed doors around the globe, decision-makers refer to these numbers – not mere statistical figures but beacons illuminating paths towards a fairer society where opportunity isn’t rationed based on privilege but extended equitably across diverse populations.