Critics argue Gini Coefficient oversimplifies income inequality.
It can’t capture nuances of wealth distribution.
The measure doesn’t address factors like social mobility.
Divides society into income brackets, overlooking individual circumstances.
Critics say Gini overlooks wealth concentration at the top.
It underestimates growing disparities in high-income groups.
The metric may not reflect true economic disparities accurately.
Some argue it lacks sensitivity to redistribution policies’ impacts.
Critics find it insufficient for capturing inequalities within groups.
There are concerns about its use in comparing different populations.
In conclusion, experts call for a comprehensive approach beyond Gini for income inequality analysis.
Table of Contents
- Applicability to Different Countries
- Definition of Gini Coefficient
- Ignoring Within-Group Inequality
- Lack of Sensitivity
- Misinterpretations
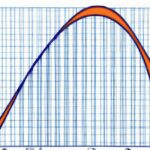
(Gini Coefficient and Lorenz Curve)
The Gini Coefficient is a widely used measure of income inequality but has limitations. Critics argue that it does not capture the full picture of inequality because it only considers income distribution in a single number. It fails to account for other factors such as wealth distribution, social mobility, and access to opportunities. Additionally, the Gini Coefficient does not reflect differences in living costs or regional disparities, which can significantly impact individuals’ quality of life.
One criticism is that the Gini Coefficient may not accurately represent inequality in countries with large informal economies or where wealth is concentrated in a small percentage of the population. This can lead to an underestimation of true inequality levels. Furthermore, the measure assumes a linear relationship between income and well-being, disregarding the complex interactions between income, education, healthcare, and other aspects of human welfare.
Another limitation is that the Gini Coefficient does not account for household size or composition, which can affect the distribution of resources within a family. This can result in an inaccurate portrayal of intra-household inequality. Critics also point out that the Gini Coefficient is limited in its ability to capture changes in inequality over time, as it is a static measure that does not reflect dynamic shifts in income distribution.
In conclusion, while the Gini Coefficient is a valuable tool for assessing income inequality, it is essential to recognize its limitations and consider other measures in conjunction to gain a more comprehensive understanding of inequality within societies.
Applicability to Different Countries
When we delve into the limitations and criticisms of the Gini Coefficient, a crucial aspect to ponder is its applicability across different countries. This measure of income inequality has been widely used and accepted on a global scale, but its effectiveness can vary significantly depending on the socio-economic landscape of each nation.
In developed countries like Sweden with well-established social welfare systems, the Gini Coefficient may not fully capture the redistribution effects that mitigate income inequality. The provision of universal healthcare, education, and robust social safety nets could lead to a more equal distribution of resources than what the Gini index suggests. In such cases, relying solely on this metric might mask the true extent of economic disparities within society.
Conversely, in developing nations characterized by informal economies and widespread poverty like Nigeria or India, the Gini Coefficient may not accurately reflect the disparity due to underreporting of incomes or wealth concealment practices prevalent in these regions. Factors such as corruption, lack of reliable data collection methods, and large informal sectors can skew results obtained from applying this measure in such contexts.
Moreover, cultural norms and societal perceptions around wealth differ greatly among countries. For instance, in some cultures where communal living is common practice or traditional values prioritize collective well-being over individual prosperity – measuring inequity purely through a numerical coefficient may oversimplify complex social dynamics unique to those regions.
The emotional resonance evoked when examining how income inequality impacts individuals’ lives across diverse nations cannot be understated. Behind every statistic lies real people grappling with financial hardships or enjoying privileges influenced by systemic inequalities ingrained in their societies. These human stories add depth to our understanding of why a singular metric like the Gini Coefficient may fall short in encapsulating all facets of disparity existing between various countries.
Therefore, while the Gini Coefficient serves as a valuable tool for comparing relative levels of inequality within specific contexts – acknowledging its limitations when applied universally becomes imperative for crafting comprehensive solutions that address economic disparities effectively worldwide.
Definition of Gini Coefficient
The Gini coefficient is like a mirror reflecting the income distribution within a specific population, helping us grasp the level of inequality that exists. It’s not just some abstract number; it carries real weight in understanding societal disparities.
Imagine you’re looking at a line graph plotting people by their income levels – from the lowest earners to the highest. The Gini coefficient crunches this data and gives you a score between 0 and 1. Picture 0 as everyone having an equal share of income (total equality), while 1 means one person has all the money (maximum inequality).
This number goes beyond statistics; it speaks volumes about fairness, social justice, and economic health. A lower Gini suggests a more balanced society where resources are spread evenly among its members. On the flip side, higher Ginis hint at widening gaps between rich and poor, pointing towards potential unrest or dissatisfaction.
But here’s where things get tricky: while useful for comparing different countries or regions, the Gini coefficient has its limits. It can’t capture everything about wealth disparities—like why those inequalities exist or how they impact individuals’ lives daily.
Some critics argue that relying solely on this number oversimplifies complex issues like poverty or discrimination. They say it fails to show nuances such as inherited wealth, access to education, or systemic biases against certain groups.
Yet despite these criticisms, we still turn to the Gini coefficient for insights into our world’s economic fabric—it remains a powerful tool in uncovering patterns of privilege and disadvantage.
So next time you hear someone mention the Gini coefficient in discussions about inequality, remember: behind that simple decimal lies an intricate web of stories waiting to be told—the tales of struggle and triumph echoing through our societies’ uneven terrain.
Ignoring Within-Group Inequality
When discussing the limitations and criticisms of the Gini Coefficient, one crucial aspect often overlooked is ignoring within-group inequality. This issue delves into disparities that exist within specific groups or categories of people, such as gender, race, or age brackets.
Imagine a society where income inequality is predominantly viewed from a macro level – looking at the overall distribution across the entire population. However, beneath this broad perspective lies a much more intricate web of inequalities nestled within various subgroups.
Within-group inequality highlights how certain demographics may face heightened levels of disparity even when the overall income distribution appears relatively equal. For instance, while a country’s Gini Coefficient might suggest an equitable income spread on paper, it could be masking substantial discrepancies faced by marginalized communities within that same society.
Consider a scenario where two regions show similar Gini coefficients but differ significantly in their internal dynamics. In one region, there might be fair wealth distribution among different demographic segments despite an average disparity between regions. On the other hand, another region with seemingly equivalent regional statistics could have severe economic imbalances plaguing specific ethnic groups or genders internally.
This oversight can lead to policymakers implementing ineffective measures under the assumption that blanket solutions will address all forms of inequality adequately. Neglecting within-group disparities not only hampers accurate assessments but also perpetuates systemic biases that harm already vulnerable populations.
The emotional toll of disregarding such nuanced inequalities cannot be understated. Picture individuals who are part of these disadvantaged subgroups feeling unheard and invisible in discussions about equality. Their struggles remain unseen behind misleading aggregate data points, making them voiceless in advocating for targeted interventions that would uplift their circumstances.
By recognizing and addressing within-group inequality alongside conventional measures like the Gini Coefficient, societies can take significant strides towards creating truly inclusive policies that leave no one behind – fostering genuine equity and opportunity for all members regardless of their background or identity markers.
(Understanding the Gini Coefficient)
Lack of Sensitivity
One of the major criticisms leveled against the Gini Coefficient is its lack of sensitivity to various income levels and distributions within a population. Imagine a tool that measures inequality, yet fails to capture the nuances and complexities of real-life economic disparities. That’s where the criticism lies – in its inability to reflect the true depth of inequality experienced by different segments of society.
The Gini Coefficient, with its single numerical value ranging from 0 (perfect equality) to 1 (maximum inequality), oversimplifies reality. It lumps together all income earners into one homogeneous mass, disregarding critical differences between individuals and households at different points on the income spectrum. This oversight can lead to misleading conclusions about overall wealth distribution within a society.
Picture this: two countries with identical Gini coefficients may appear equally unequal on paper, but their actual poverty rates and living conditions could be vastly disparate. The lack of sensitivity inherent in this metric fails to account for such crucial distinctions that shape people’s lived experiences.
Moreover, consider a scenario where extreme wealth is concentrated in the hands of a few billionaires while the majority struggle below the poverty line. In such cases, the Gini Coefficient might not adequately convey the severity of disparity or accurately represent societal injustice.
This insensitivity becomes even more pronounced when we factor in non-monetary aspects like access to healthcare, education, and social services. A community may have an equitable income distribution according to Gini calculations but still face significant inequalities in opportunities and quality of life due to systemic barriers that go beyond mere monetary transactions.
Critics argue that relying solely on a simplistic measure like the Gini Coefficient overlooks these multidimensional aspects of inequality. It reduces complex social realities into abstract numbers, blurring out individual stories hidden behind data points.
In conclusion,, while useful as a broad indicator of economic disparity,, it’s essential.. important…to acknowledgeits limitationsand seek complementary metrics.and consider alternativeapproachesfora more nuanced understandingofinequalityacross diversepopulations., Buildinga more comprehensiveframeworkthat captures therichnessof humanexperiencewill helpto addressthe issueoflackofsensitivityinmeasuringeconomicinequality effectively.empoweringusto make informedpoliciesandexertmeaningfulchangein our world.”
Misinterpretations
Misinterpretations of the Gini Coefficient can lead us down a twisted path, clouding our view of inequality and societal dynamics. At first glance, this numerical representation seems straightforward—it assigns a single value to indicate income distribution within a population. However, beneath its seemingly concrete facade lies a web of complexities waiting to be unraveled.
One common misstep in interpreting the Gini Coefficient stems from viewing it in isolation. Imagine gazing at an abstract painting through a keyhole; you catch only fragments of the whole picture. Similarly, focusing solely on this index blinds us to nuances that shape economic disparities—like generational wealth accumulation or systemic discrimination—that cannot be captured by one number alone.
Moreover, misconceptions arise when we equate higher Gini values with unequivocal inequality. Numbers do not tell stories; they merely hint at underlying narratives waiting to be heard. A rising Gini coefficient might signal increased disparity among incomes but may overlook social policies aiming to uplift marginalized communities or innovative initiatives striving for equitable opportunities.
Let’s not forget how context molds the narrative painted by the Gini Coefficient. It’s akin to observing shadows cast by trees at different times of day—their shapes shifting as sunlight dances across their leaves. The same applies here; without considering historical legacies, cultural norms, or geopolitical factors influencing income distribution, we risk missing crucial layers essential for comprehensive understanding.
Emotions often run high when confronting issues related to inequality and poverty—a reality all too familiar for many individuals worldwide. The numbers behind the Gini Coefficient hold power in shaping policies impacting real lives—a responsibility not to be taken lightly nor interpreted superficially.
In conclusion, navigating through misinterpretations surrounding the limitations and criticisms of the Gini Coefficient requires more than just crunching numbers; it demands empathy and deep reflection on multifaceted human experiences intertwined with socioeconomic structures—the kindling that fuels debates on equity and justice in our ever-evolving world.